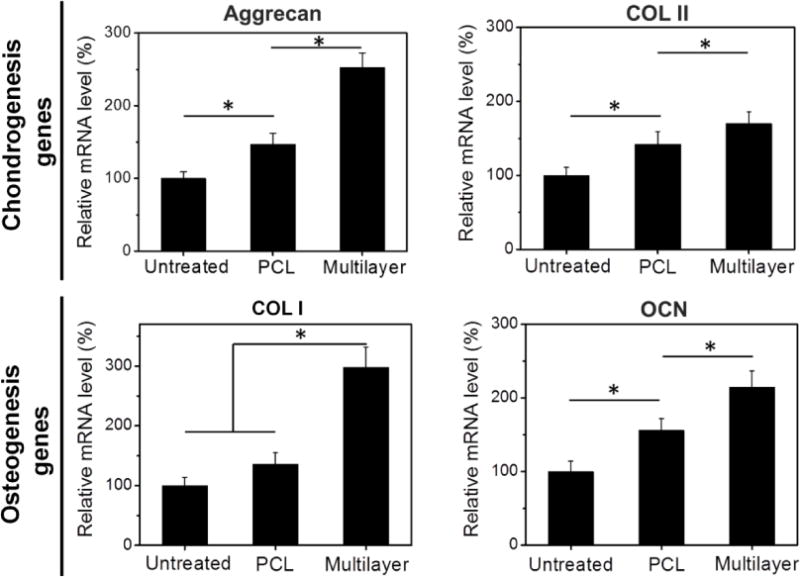
Fig. 9. Gene analysis for chondrogenesis and osteogenesis in newly formed tissue at week 12.

qRT-PCR results demonstrated that the multilayer group showed the highest expression of cartilage-associated genes, such as aggrecan and collagen type II (COL II), as well as the osteogenesis-associated genes, such as collagen type I (COL I) and osteocalcin (OCN). Data are shown as mean ± standard deviation for n = 3. (*) indicates a significant difference between groups (p < 0.05).
