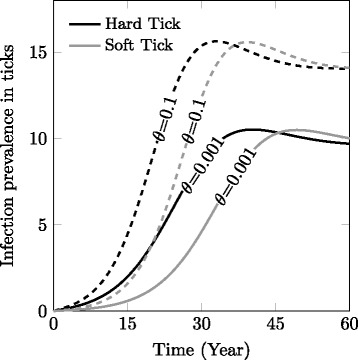
Fig. 5.

Infection spread in the new patch through stage-dependent and bidirectional dispersal prevalence for low (solid lines, θ = 0.001) and high vertical (transovarial) transmission rates (θ = 0.1, dashed lines), following arrival of susceptible and infected ticks from patch 1. Default parameters are found in Table 1. Only 1 bloodmeal per stage (c = 1) is considered. The polyphagous nature of soft ticks (c > 1) partially compensates for the lag in local density, but the infection prevalence in soft ticks, still does not reach that of hard ticks (see Additional file 2: Figure S2, for details)
