Fig. 4.

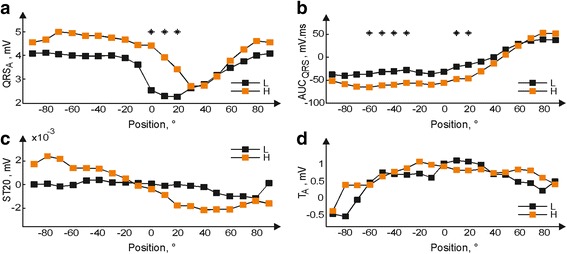
Median values of QRSA (a), AUCQRS (b), ST20 (c), and TA (d) calculated from electrograms recorded in hearts with low (L) and high (H) LV mass fraction in the range from −90° to 90° (* p < 0.05)

Median values of QRSA (a), AUCQRS (b), ST20 (c), and TA (d) calculated from electrograms recorded in hearts with low (L) and high (H) LV mass fraction in the range from −90° to 90° (* p < 0.05)