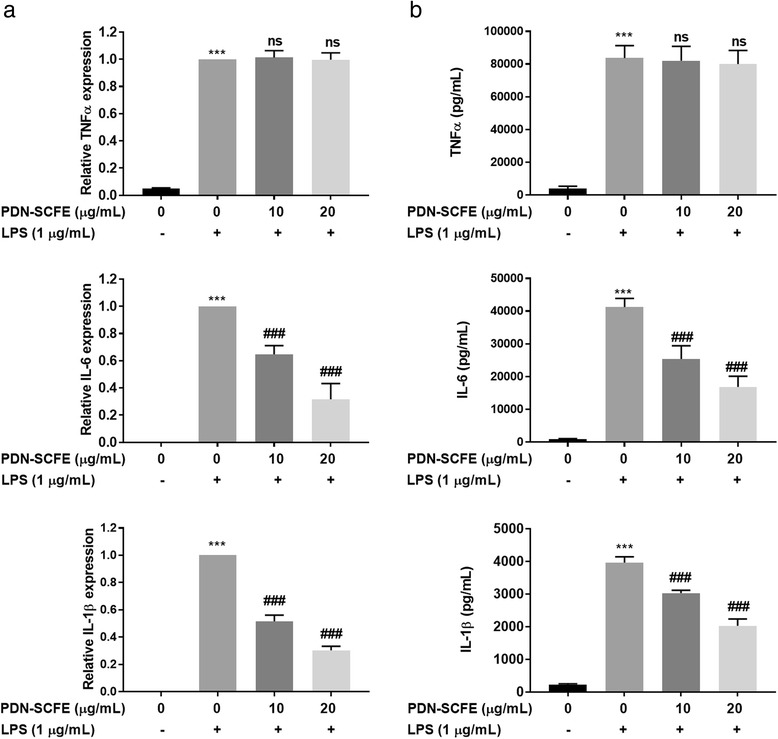
Fig. 4.

Effect of PDN-SCFE on LPS-induced cytokine (a) mRNA and (b) protein expression in RAW 264.7 cells. The cells were pre-treated with indicated concentrations of PDN-SCFE for 2 h, followed by LPS for 6 h (a, mRNA expression) or 18 h (b, protein expression) The cell-free supernatant was subjected to quantify TNFα, IL-6 and IL-1β levels, using ELISA kits, according to manufacturer’s protocol. Total RNA was extracted with Trizol reagent and subjected to qRT-PCR according to the manufacturer’s instructions. The graphical figures represent the change in mRNA expression normalized to actin. Data represent mean ± SD from three separate experiments. *** P < 0.001 vs control group; ### P < 0.001 vs LPS-stimulated group; ns-non significant vs LPS-stimulated group
