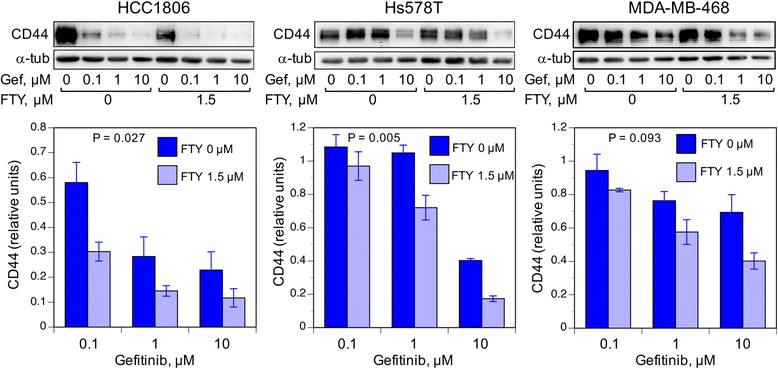
Fig. 3.

The effect of gefitinib-FTY720 treatment on CD44 expression in TNBC cell lines. HCC1806, Hs578T, and MDA-MB-468 TNBC cell lines at ~40% confluence in 12-well plates were exposed for 24 h to gefitinib (Gef: 0.1 to 10 μM), with or without the addition of 1.5 μM FTY720, as indicated. Upper panels: detection of standard isoform (~80 kDa) CD44 in cell lysates by western blotting. α-Tubulin (α-tub) is shown as a loading control. Lower panels: quantitation of the ~80-kDa band density was normalized to band density for cells receiving 0 gefitinib. Bars are mean value ± SEM for six (HCC1806), six (Hs578T) or three (MDA-MB-468) replicate samples. P values indicate significance of the effect of FTY720 addition, calculated over the three gefitinib doses by repeated measures ANOVA
