Fig. 3.

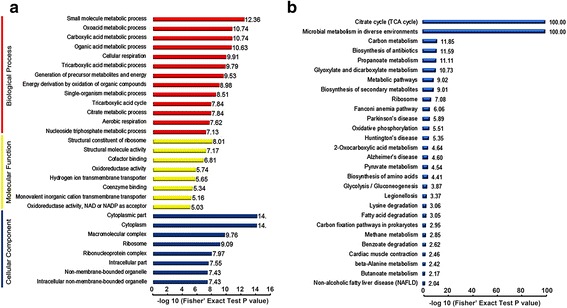
The enrichment analysis of the succinylated proteins. a The GO enrichment based on the biological processes (p < 10−7), molecular functions (p < 10−5) and cellular components (p < 10−7) of the proteins. b KEGG pathway enrichment (p < 0.01)

The enrichment analysis of the succinylated proteins. a The GO enrichment based on the biological processes (p < 10−7), molecular functions (p < 10−5) and cellular components (p < 10−7) of the proteins. b KEGG pathway enrichment (p < 0.01)