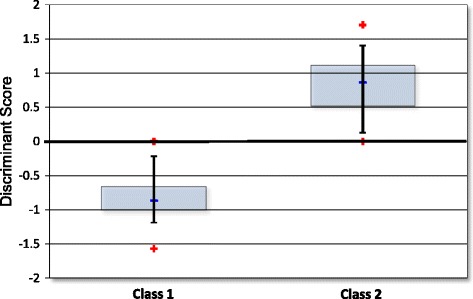
Fig. 5.

Distribution of discriminant scores. The distribution of discriminant scores that have been reported clinically. The output of the SVM algorithm is negative for Class 1, but reported as a positive number. The 50th percentile is represented by the blue box and the black bars indicate the 90th percentile. The blue line is the median of each group and the red stars indicate the minimum and maximum observed scores of each Class
