
Figure 8. Muscle fiber size and type distribution.
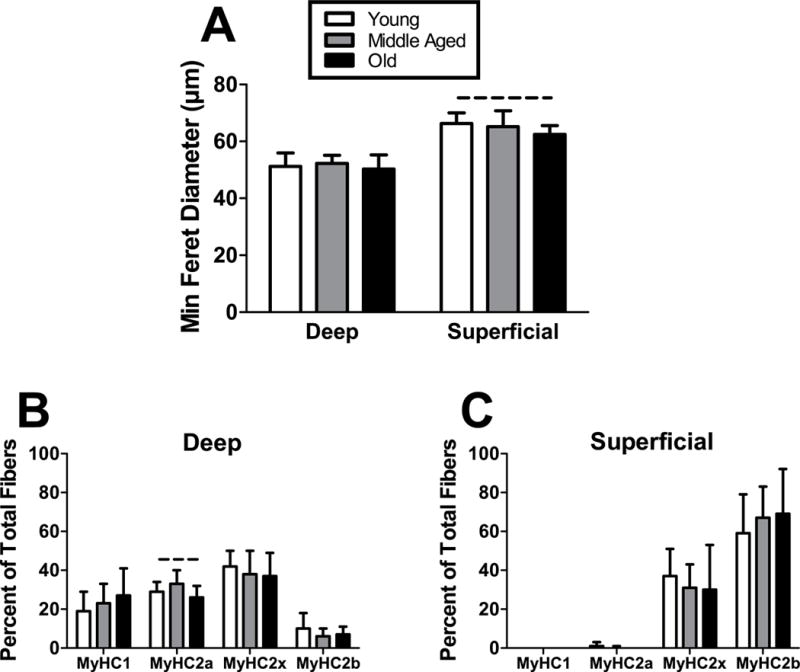
(A) Fiber size was not different across age groups in the deep region, but there was a trend towards inferior fiber size in Old animals in the superficial region. In the deep region, (B) fiber type distribution generally did not vary across age, except for a trend towards decreased type 2a in Old animals. Fiber type distribution in the (C) superficial region was not significantly altered by age. n = 7/group. Data represented as means and error bars indicating standard deviation. Solid lines indicate significant differences (p < 0.05/3) and dashed lines indicate trends (p < 0.10).