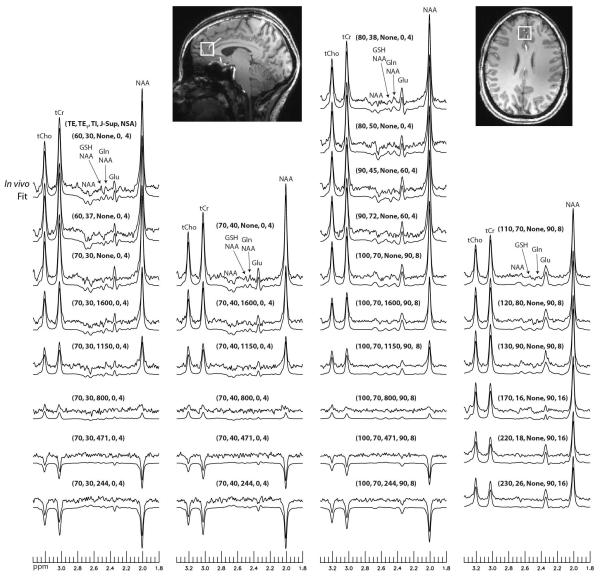
Fig. 4.
Stack plots of reconstructed spectra and corresponding fits from the frontal GM voxel of one healthy volunteer. TE (ms), TE1 (ms), TI (ms), J-suppression flip angle (deg), and NSA (number of signal averages) values for the 30 sets of acquisition parameters are listed above the corresponding spectra.

