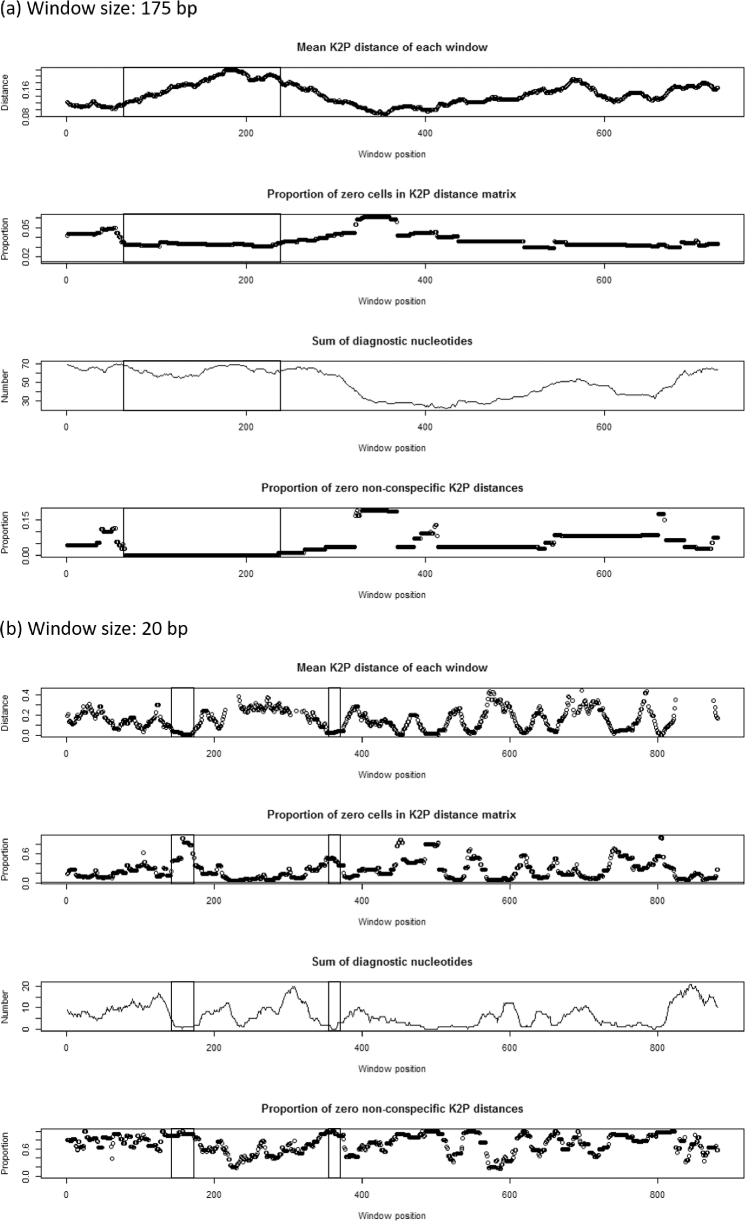
Figure 2:
Results of the sliding window analysis conducted using the R package SPIDER for the 12S rRNA gene using window sizes of (a) 175 bp and (b) 20 bp to identify candidate mini-barcode regions and conserved primer sites, respectively. For all panels, the x-axes represent the position of each window within the sequence alignment, with each data point marking the position of the first nucleotide of 1 window. The first (top) panels display the mean K2P distances (a measure of genetic differentiation among species, where a value of 0 means that sequences are identical) calculated for each window, with K2P values represented on the y-axes. The second panels represent the proportion of 0 cells in the K2P distance matrix. A high proportion of inter-specific genetic distances that are equal to 0 indicates sequences that are highly conserved among species. The third panels display the number of nucleotides that are diagnostic among species within each window. The fourth (lowest) panels indicate the proportion of 0 non-conspecific K2P distances within each window. When this value is 0, it indicates that the sequence region has high potential to discriminate among species. The area boxed within each panel denotes (a) the regions containing the first bases where a mini-barcode of ca 175 bp can be developed and (b) the regions containing the first bases where conserved primer sites can be developed.

