Fig. 3.

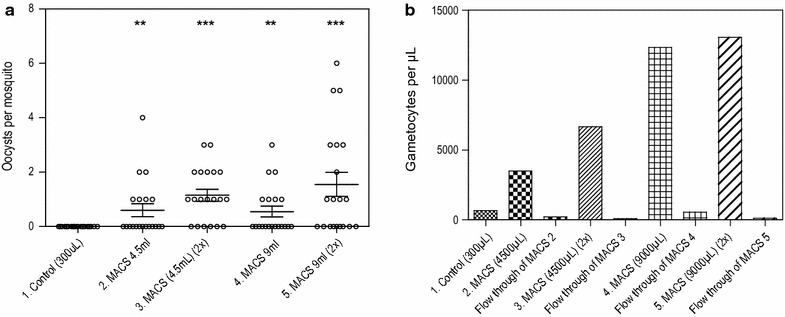
Concentration and infectivity of low gametocyte densities after MACS. a 1 300 µL of gametocyte-infected whole blood from starting material, fed directly (control). 2 4500 µL of gametocyte-infected whole blood from starting material added once over MACS column, eluted and reconstituted in 400 µL of uninfected blood, from which 300 µL was fed. 3 4500 µL of gametocyte-infected whole blood from starting material run twice over MACS column, eluted and reconstituted in 400 µL of uninfected blood, from which 300 µL was fed. 4 9000 µL of gametocyte-infected whole blood from starting material added once over MACS column, eluted and reconstituted in 400 µL of uninfected blood, from which 300 µL was fed. 5 9000 µL of gametocyte-infected whole blood from starting material run twice over MACS column, eluted and reconstituted in 400 µL of uninfected blood, from which 300 µL was fed. Vertical bars indicate mean with SEM. **p < 0.01, ***p < 0.001. b Gametocyte density per sample from feeding material measured by Pfs25 qRT-PCR. Flow through of MACS represents the loss of gametocytes after MACS purification
