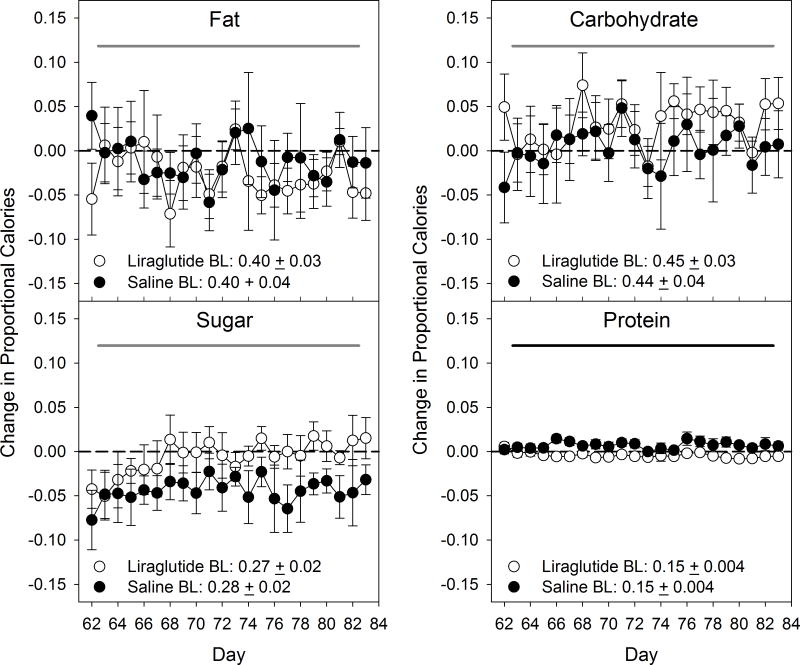
Figure 4.
Mean ± SE change in proportional caloric intake from individual macronutrients and sugar in the cafeteria diet foods during the Cafeteria Diet No Drug phase. Shaded line denotes statistical difference (black: group effect; dark grey: day effect; light grey: day x group interaction; p≤ 0.05). Additional corresponding statistics can be found in Table 4. N=6/group.

