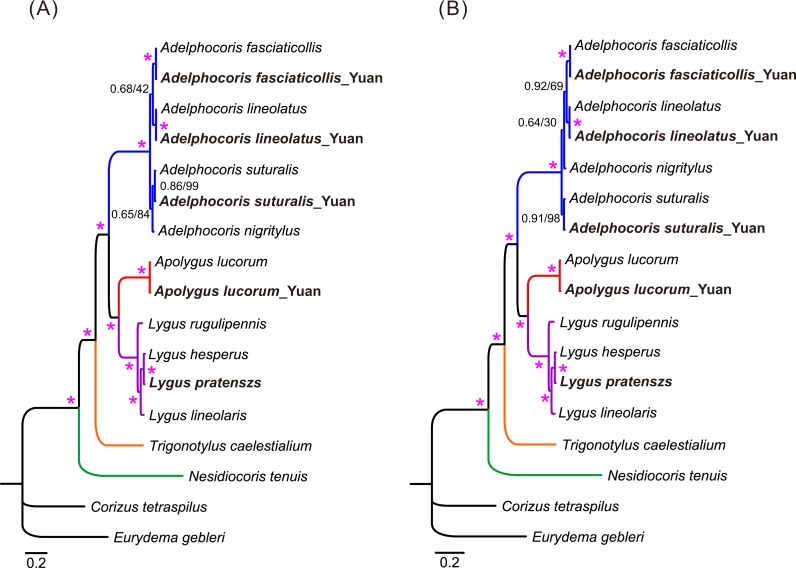
Figure 3. The mitochondrial phylogeny of eleven mirid bugs based on the two combined datasets: (A) P123 and (B) P123RT.
Numbers on branches are Bayesian posterior probabilities (PP, before slash) and Bootstrap values (BS, after slash). Asterisk (*) indicates PP = 1.0 and BS = 100. Species sequenced in the present study are bold.

