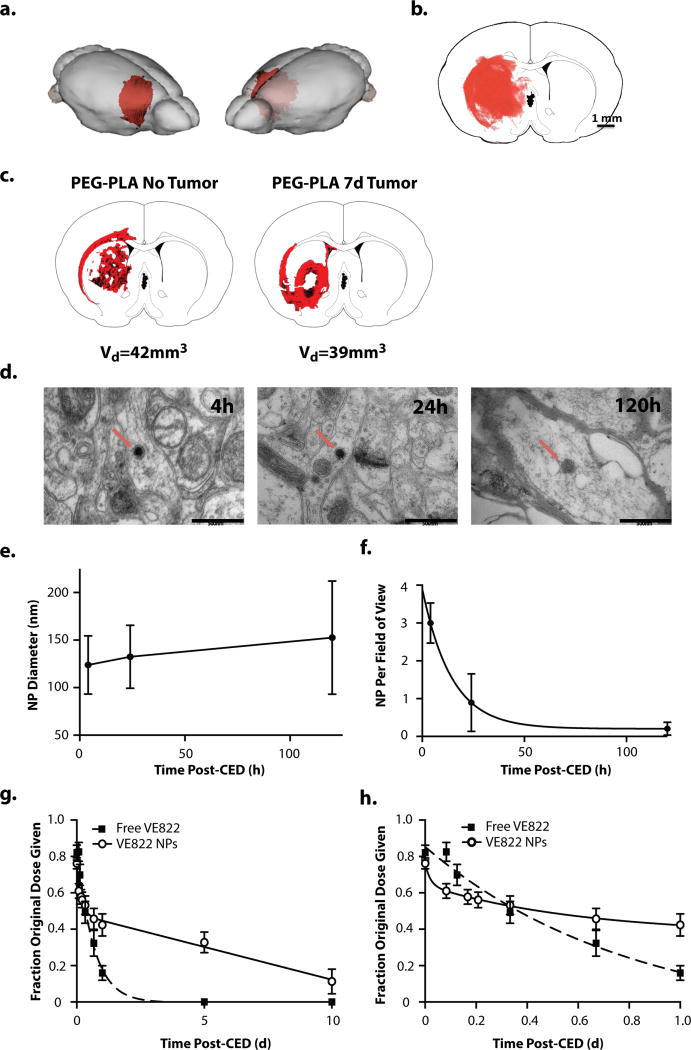
Figure 4. in vivo intracranial CED of PLA-PEG NPs into the R caudate of immunocompetent Fisher344 rats.
a.,b., and c.. NP volume of distribution immediately following CED of DiI-loaded PLA-PEG NPs. a. 3D distribution of DiI-loaded NPs superimposed on rat brain. The volume of distribution was reconstructed from serial 50um-thick coronal slices through the injection site. b. Representative fluorescently-imaged 2D coronal section at the site of injection. DiI channel (NPs) in red. c. Comparison of DiI-loaded NP distribution in normal rat brain (left) and rat brain with tumor xenograft (right). d. in vivo TEM imaging of caudate tissue samples from healthy rat brains harvested 4, 24, and 120 h after CED of DiD-loaded PLA-PEG NPs. NP indicated by red arrow. e. Average NP diameter over time as measured via TEM image analysis f. Average number of NPs per wide (2um scale) field of view as measured via TEM image analysis. g. and h. VE822 tissue levels following CED of either free VE822 (squares) or VE822-NPs (circles). Data analyzed using ex vivo standards of brains spiked with drug. Saline with equivalent volume of DMSO (drug solvent) and equivalent weight of blank NPs, respectively, were subtracted out as background in data analysis. Free VE822 was fit to a single-phase exponential decay model (R2 = 0.99) with t1/2 = 10.5h. VE822-NP was fit to a two-phase exponential decay model (R2 = 0.99) with 42.3% being rapidly cleared during the fast phase, with t1/2 = 2.2h followed by a slow phase with t1/2 = 8.2d. g. full data through 10d following CED h. close-up of initial 24h following CED

