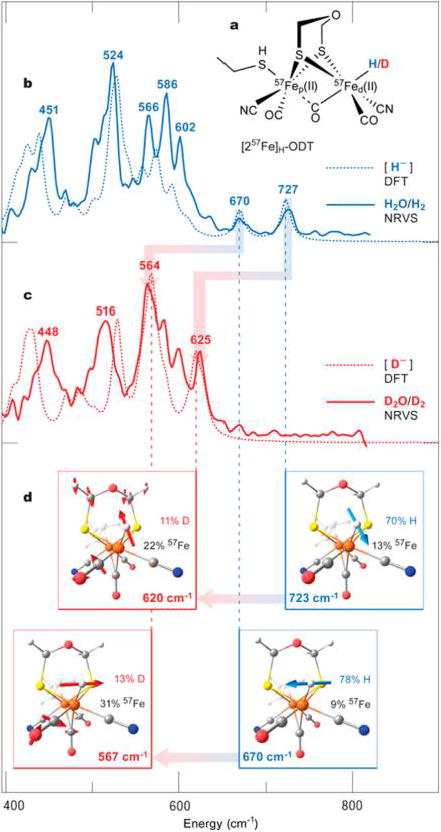
Figure 3.

Experimental and DFT calculated NRVS spectra of CrHydA1 maturated with [257Fe]H-ODT. (a) Schematic representation of the [257Fe]H-ODT DFT model. (b,c) NRVS spectra (solid lines) of CrHydA1([257Fe]H-ODT) in the 400–800 cm−1 range recorded on samples in (b) H2O/H2 (blue) and (c) D2O/D2 (red), shown overlaid with the corresponding DFT spectra (broken lines) of [257Fe]H-ODT; the NRVS bands are labeled with their positions (cm−1). (d) Representations of the DFT δ(57Fed–H/D) normal modes assigned to the individual NRVS bands; mode frequencies and contributions (%) to the vibrational energy from the 57Fe/H/D nuclei are given. The calculated NRVS band positions were scaled with factor of 0.96. For the full-range (0–800 cm−1) spectra, see Figures S2 and S3.
