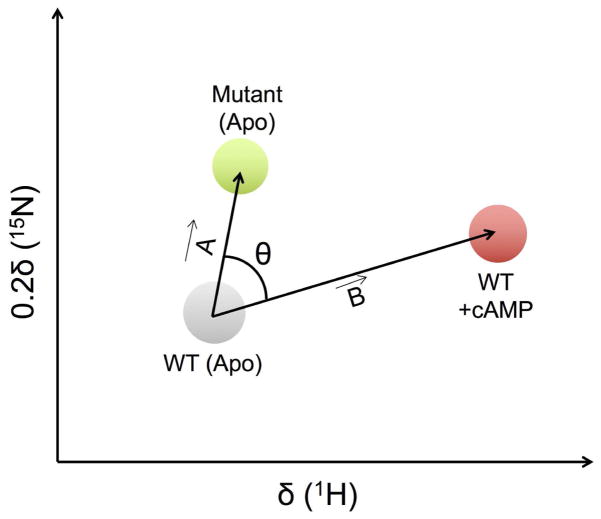
Figure 2. Illustration of the CHESPA approach.
1H-15N resonance assignments for apo, mutant and cAMP-bound forms of EPAC are represented as grey, green, and red circles, respectively. The compounded chemical shift upon mutation and ligand binding is calculated as the magnitude of vectors A and B, respectively (see text for details). θ represents the angle between vector A and B. Figure adapted from ref. 43.

