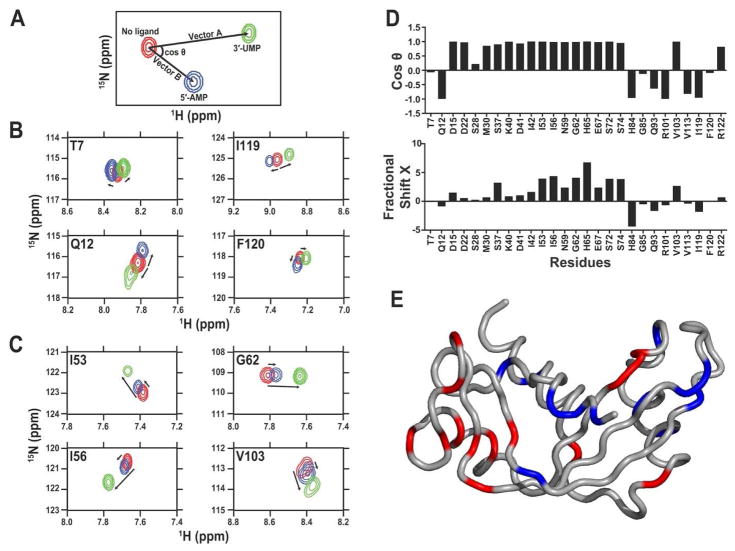
Figure 3. Application of CHESPA to human angiogenin.
Projection analysis describing independent and coordinated residue variations upon 5′-AMP and 3′-UMP binding to human angiogenin subsites. (A) Graphical representation of the CHESPA approach described in ref. 43. The 1H-15N position of the peak is represented for the free (red) and bound forms (5′-AMP in blue and 3′-UMP in green) of the enzyme. Arrows indicate the movement of the 1H-15N chemical shift (length and direction) for each peak from its origin (in red) to its saturated position (blue and green). Projection analysis of eight selected residues responding in (B) independent or (C) coordinated manner in human angiogenin. (D) Direction cosθ and magnitude (fractional shift X) of the chemical shift perturbation of a subset of residues of angiogenin upon binding to saturation of the 5′-AMP and 3′-UMP. The cosθ quantifies the angle between vectors A (3′-UMP) and B (5′-AMP) from its initial position in the free form of the enzyme. The fractional shift X represents the fractional composite of vectors A and B induced by the ligand-induced chemical shift change. Collectiveness was observed for residues with a cosθ ~ 1, as previously described 43. (E) Residues showing coordinated displacements (cosθ ~ 1) are represented in red on the three-dimensional structure of human angiogenin, while residues showing uncoordinated displacements (cosθ ≠ 1) are shown in blue. Reprinted with permission from ref. 50. Copyright 2015 Wiley.

