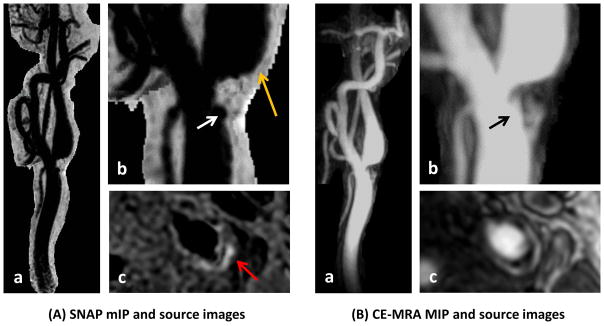
Figure 4.
Carotid bifurcation plaque shown on SNAP MRA (A) and CE-MRA (B). Note the conspicuous lumen boundaries on SNAP minimum intensity projection (mIP) images right after the stenosis where turbulent flow is expected (A-b, orange arrow). Also observed are surface ulceration (white and black arrows) and IPH (A-c, red arrow).

