
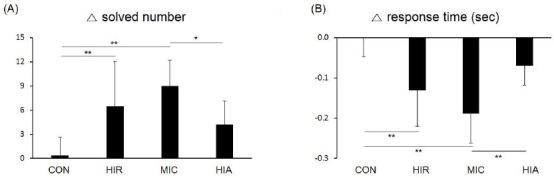
Figure 2. Changes in (A) solved number and (B) reaction time on the Stroop test (neutral task) during 60 seconds after protocol treatments in each group. Error bars are mean standard deviations. *p<0.05, **p<0.01.
Official websites use .gov
A
.gov website belongs to an official
government organization in the United States.
Secure .gov websites use HTTPS
A lock (
) or https:// means you've safely
connected to the .gov website. Share sensitive
information only on official, secure websites.