
Fig. 1.
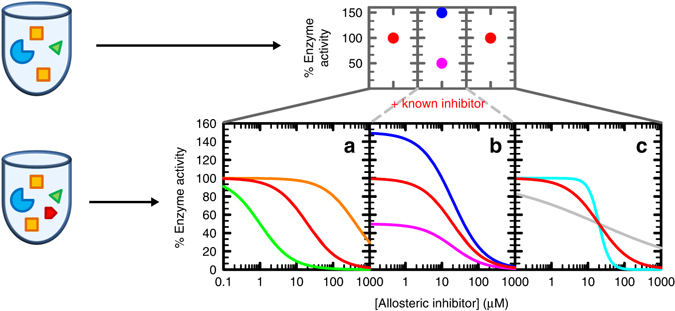
Schematic representation of CoSPI method vs conventional screenings. In the Compound Screening in the Presence of an Inhibitor (CoSPI) strategy, complete IC 50 curves are recorded for a known inhibitor in the presence of each of the test compounds. The enzyme is in blue, substrates in yellow, known inhibitor in red and compound to test in green. The top panels show the single points observed in a conventional screening (red dots are missed hits, blue is an activator and pink an inhibitor). The bottom panels show the information-rich patterns observed using CoSPI. Curves depict simulated data for an inhibitor with IC 50 = 20 µM, Hill number of 1 and capable of full inhibition (100 to 0% activity). The red curve are the data for the known inhibitor in the absence of other molecules. a Effects in the potency of the inhibitor. Green, increase in the apparent affinity of the inhibitor. Orange, decrease in the apparent affinity of the inhibitor. b Effects in the activity of the enzyme independently of the inhibitor. Blue, increase in the activity of the enzyme. Pink, decrease in the activity of the enzyme. c Effects in inhibitor-enzyme cooperativity. Cyan, increase in the cooperativity of inhibition. Grey, decrease in the cooperativity of inhibition