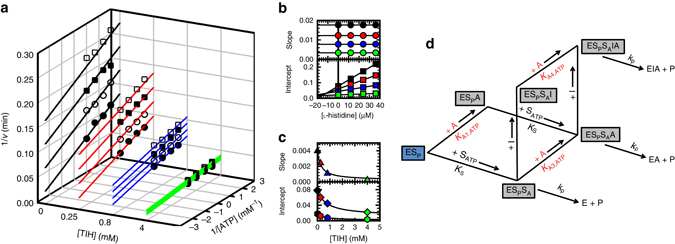
Fig. 3.

l-His inhibition kinetics in the presence of TIH. a Four double-reciprocal plots showing linear uncompetitive inhibition patterns determined for l-His in the presence of 0 (black), 0.25 (red), 0.8 (blue) and 4 (green) mM TIH, at fixed variable concentrations of ATP. Results are representative of two independent experiments. Points are experimental data obtained with 0 (black circles), 12 (white circles), 24 (black squares) and 36 (white squares) µM l-His. Lines are the best fit of each uncompetitive pattern data set to Eq. 5 in Methods section. b Secondary replot of the slopes (circles) and intercepts (squares) of the data shown in a. c Tertiary replots of the slopes (top panel) and intercepts (lower panel) of the data shown in b. Slope of the intercept (triangles), intercept of the intercept (diamonds) and intercept of the slope (hexagons). Lines are the best fit to Eq. 7 in Methods section. d Kinetic model for a combination of uncompetitive inhibition and non-essential activation. The complexes in boxes are in equilibrium. The blue box indicates that this complex is always present in the assay. E, Enzyme; SA, ATP; SP, PRPP; A, TIH; I, l-His; P, Product
