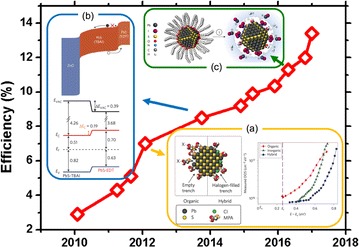
Fig. 4.

NREL efficiency chart of CQD PVs. a Schematic of a CQD treated with an MPA ligand and a chloride (inorganic) ligand; density of states in the energy bandgap obtained from a transient photo-voltage measurement (reprinted with permission from ref. 21, Copyright 2012 Macmillan Publishers Ltd.). b Band diagram of a CQD PV based on electron blocking with EDT-exchanged CQDs; energy band positions for various ligands obtained from ultraviolet photoelectron spectroscopy analysis (reprinted with permission from ref. 22, Copyright 2014 Macmillan Publishers Ltd.). c Schematic of CQD and CQD ink (reprinted with permission from ref. 25, Copyright 2016 Macmillan Publishers Ltd.)
