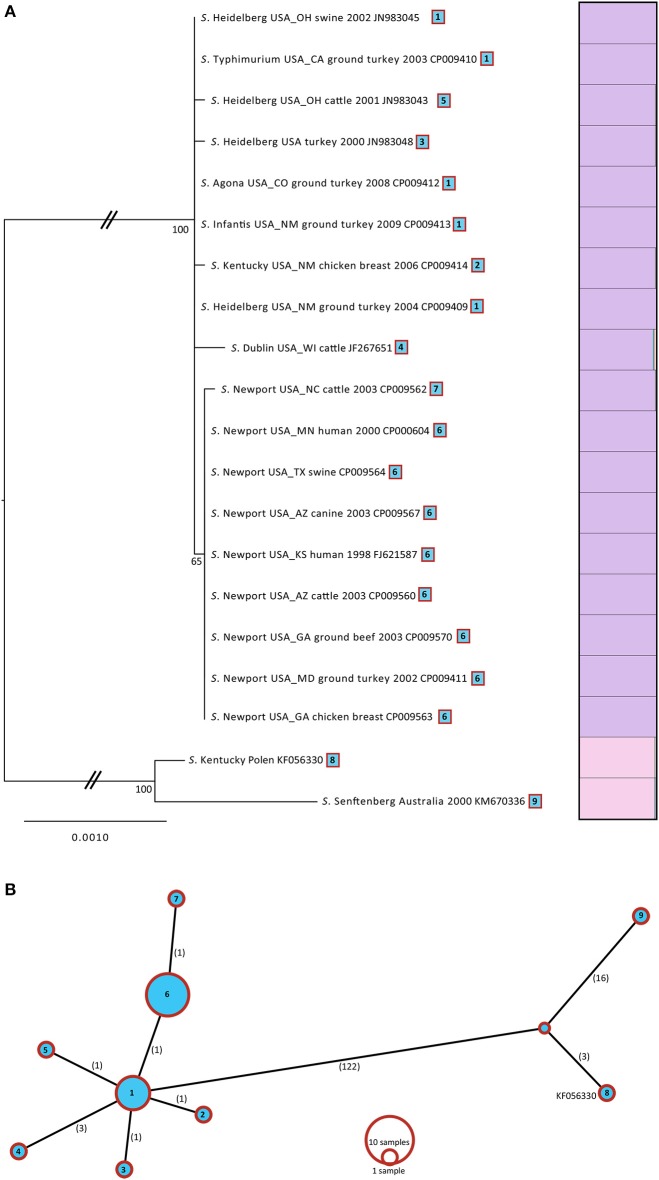
Figure 3.
(A) ML tree based for 20 IncA/C plasmids isolated from Salmonella. A total of 23 genes with 149 variable SNPs were found using Ridom (SeqSphere+). The ML tree was generated in GARLI v.2.0 under the GTR + Γ model of nucleotide evolution and visualized using Figtree v1.3.1. To the right of the tree, a Distruct plots were reconstructed with the gene matrix. The Distruct plot was generated using a model-based Bayesian clustering method implemented in STRUCTURE v2.3.2 and visualized with DISTRUCT v1.1. Different colors represent the different clusters and each bar represents an individual isolate. The fraction of the bar that is a given color represents the coefficient of membership to that cluster (e.g., multicolored bars indicate membership to multiple groups indicative of admixture). The taxa of source for each isolate, geographic location, and date were mapped onto the tree. (B) Minimum spanning tree based for 20 IncA/C plasmids isolated from Salmonella. The spanning tree was generated in Beast. The numbers of SNPs are shown on each branch.

