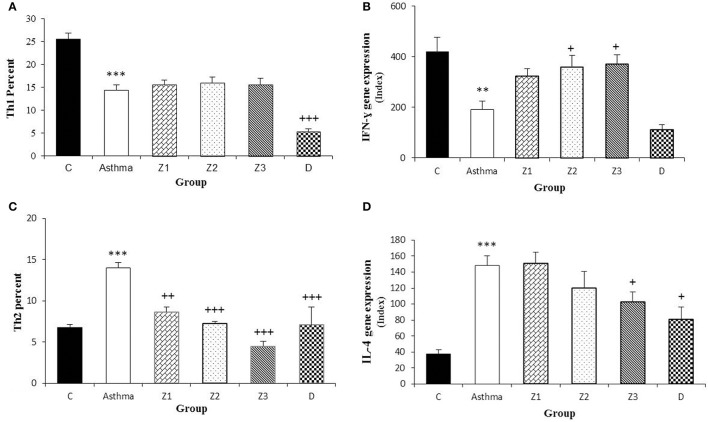
Figure 4.
Percent of Th1 and Th2 cells (A,C) and values of IFN-γ and IL-4 gene expression (B,D) in splenocyte from control group (C, n = 5), Asthma group (A, n = 5) and A treated groups with the extract of Z. multiflora at concentrations 200, 400, and 800 μg/mL (groups Z1, Z2, and Z3, respectively, n = 6) and dexamethasone (D, n = 5). Data were presented as mean ± SEM. **p < 0.01, ***p < 0.001, vs. control group. +p < 0.05, ++p < 0.01, +++p < 0.001, vs. asthma group. The statistical comparisons were made using ANOVA with Tukey–Kramer multiple post-hoc test.

