
FIGURE 1.
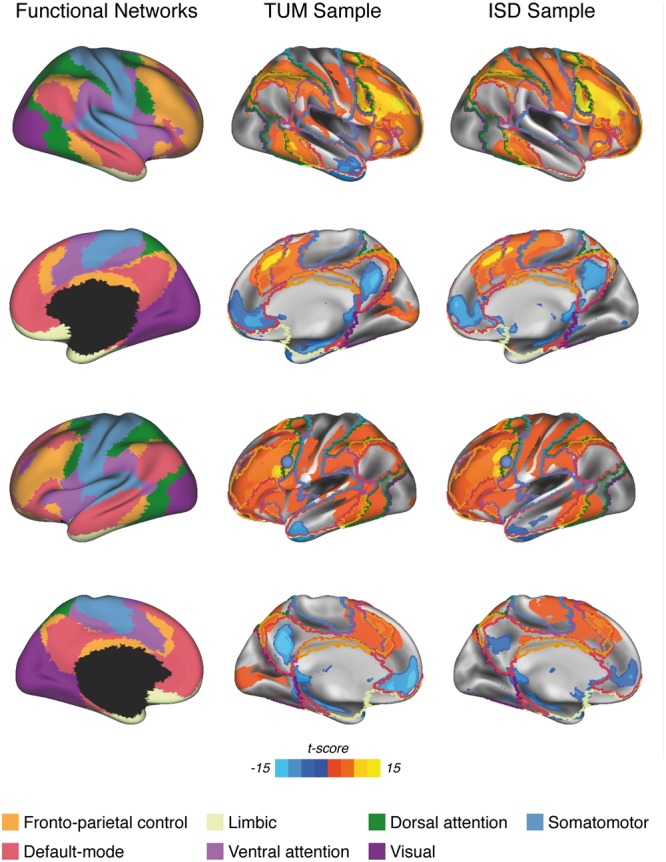
Surface renderings of significant LFC-connectivity in the TUM sample and the ISD sample (pooled across diagnostic groups) at a voxel threshold of α < 0.001, FWE-cluster-corrected at α < 0.05, superimposed on the functional network parcellation that was used for the current analyses. The LFC seed-ROI is superimposed as a blue sphere on surface renderings of the left hemisphere (3rd row).