
FIGURE 2.
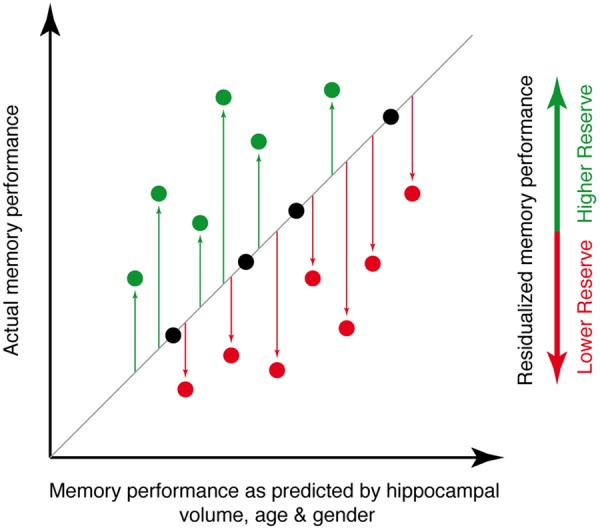
Illustration of the principle underlying the memory reserve measure used for the current study. The actual level of memory performance is plotted against the memory performance as predicted by age, gender and hippocampal volume. Individuals whose actual memory performance level is higher than predicted (green circles) have high memory reserve, whereas individuals whose actual memory performance is lower than predicted (red circles) have low memory reserve.