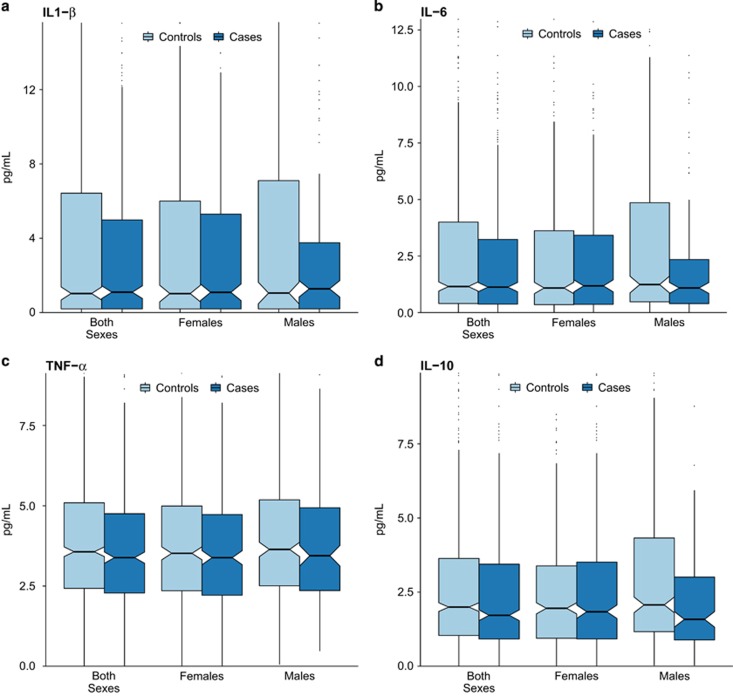
Figure 1.
Distributions of IL1-β (a), IL-6 (b), TNF-α (c), and IL-10 (d) concentrations in late-second and early-third trimester maternal serum among depression cases and controls without depression (n=1258). The y axis of each graph extends to the 90th percentile of the distribution of each cytokine. The center lines of each box represent the median, and the diagonal notches in each box represent 95% confidence intervals around the median. IL, interleukin; TNF, tumor necrosis factor.

