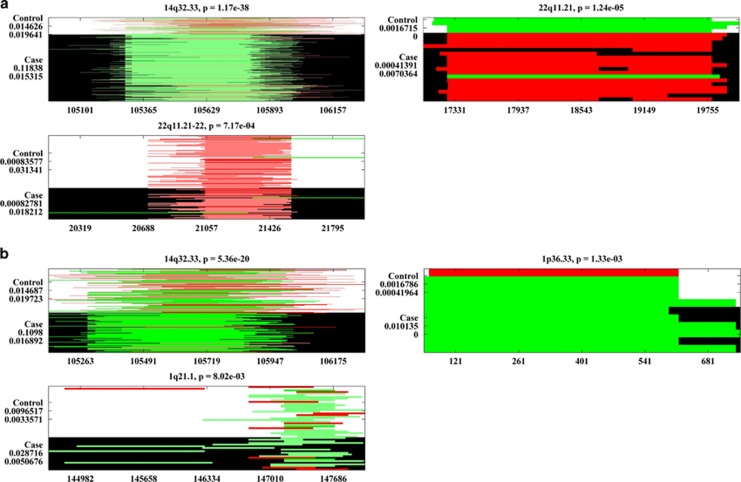
Figure 3.
Large (size⩾500 kb) copy number variant regions (CNVRs) associated with schizophrenia (SZ; European Ancestry (EA)) plotted in (a) and bipolar disorder (BD; EA) in (b). Each subplot represents one identified CNVR. The control group is shown in a background color of white and the case group in black. CNV duplications are plotted in green and deletions in red. The x axis displays the CNVs’ positions in the unit of kb. On the y axis, ‘Control’ and ‘Case’ groups are marked, each followed by two numbers referring to CNV duplication and deletion frequencies in the specific group.

