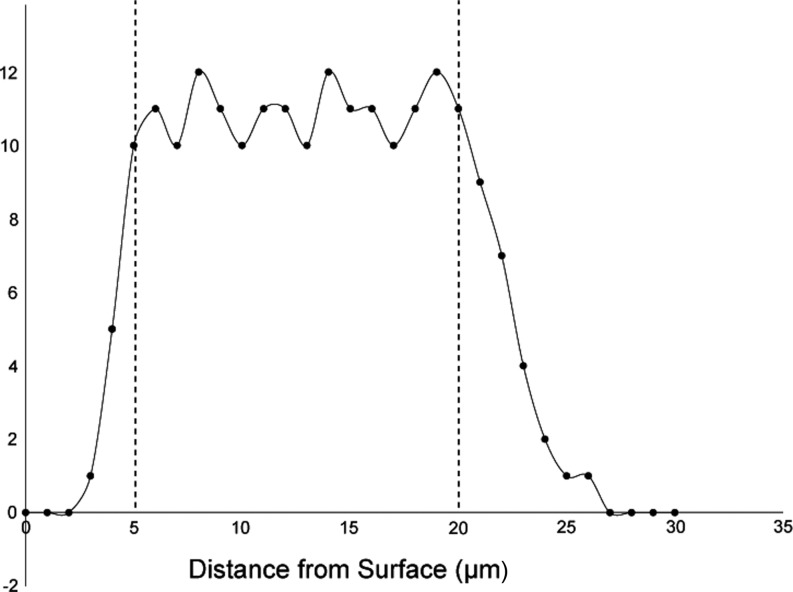
Fig. 5.
Illustration of a Z-distribution graph. In a pilot study, the number of cells counted at each location in the Z-axis (the section thickness) can be plotted. This can be used to determine where in the section thickness the number of cell counts drops off, which can then be applied as guard zones. In this example, the number of counts tapers dramatically less than 5 micrometers from the surface, and again approximately 20 micrometers into the section. For the study, guard zones would be applied so that no cells are counted from 0–5 micrometers and from 20–30 micrometers within the section thickness.

