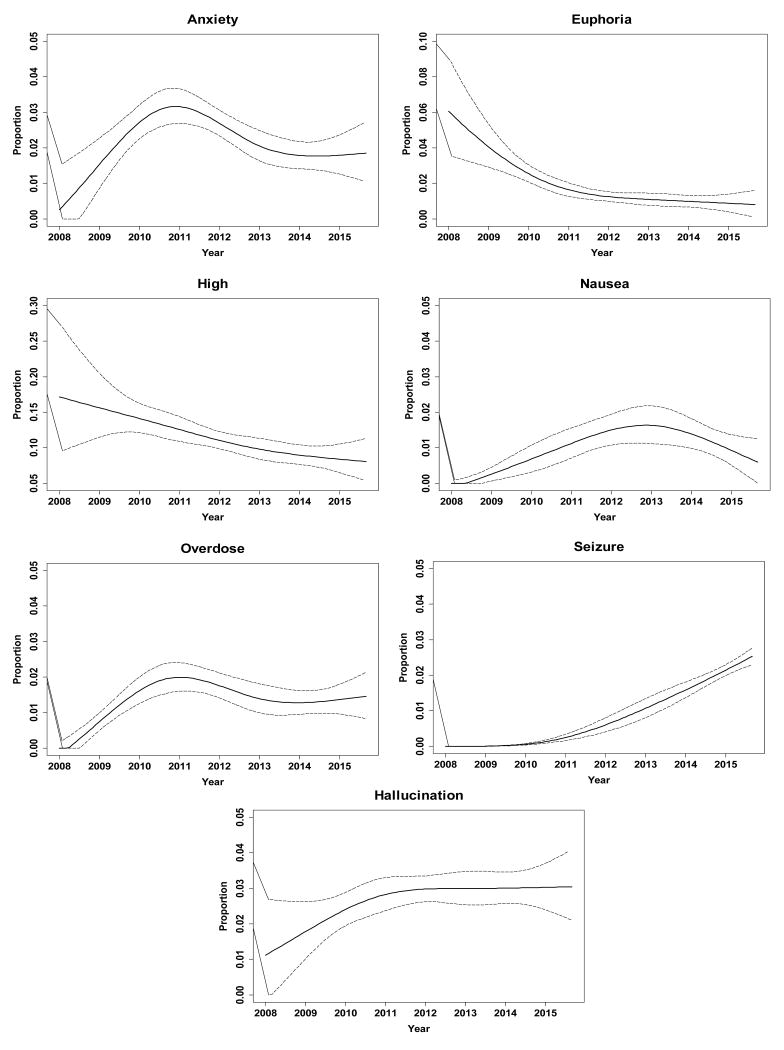
Figure 3.
Proportion* of SCRA-Only Posts mentioning each of the seven most frequently mentioned effects (January 1, 2008 to September 30, 2015) (solid line = estimated mean, dotted lines = 95% confidence interval for the mean)
*The scales were chosen to highlight the shape of each trend rather than the magnitude of the proportions. If plotted on a scale from 0% to 100%, trends in rare side effects would not be visible. Thus, not all figures have the same vertical scaling.

