Fig. 3.

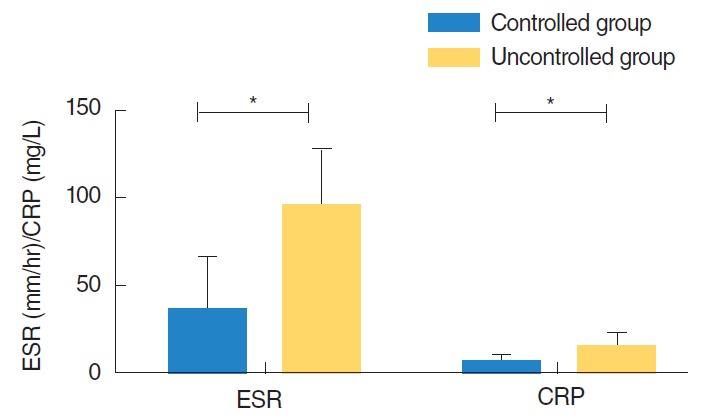
Comparison of inflammatory marker (ESR, CRP) between two groups. ESR, erythrocyte sedimentation rate; CRP, C-reactive protein. *Statistically significant (P<0.001, P<0.001; Student t-test).

Comparison of inflammatory marker (ESR, CRP) between two groups. ESR, erythrocyte sedimentation rate; CRP, C-reactive protein. *Statistically significant (P<0.001, P<0.001; Student t-test).