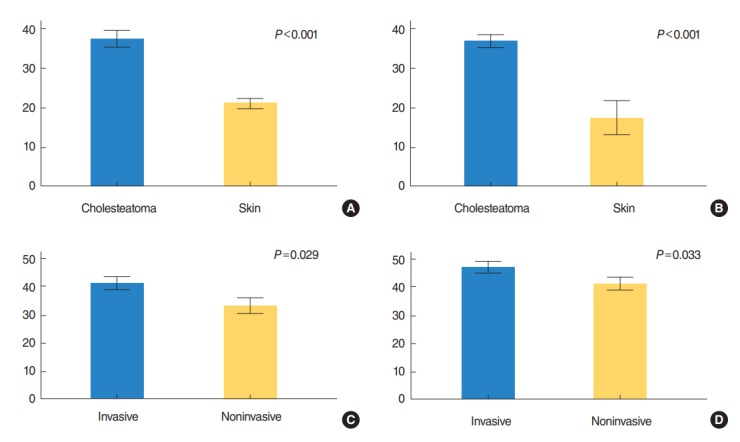
Fig. 1.

(A, B) Expression of Ki-67 and cytokeratin 17 (CK17) in cholesteatoma versus skin (tissue group, mean±SE) and (C, D) in invasive versus non-invasive cholesteatoma (cholesteatoma group, mean±SE). Note overexpression of both Ki-67 and CK17 in cholesteatoma compared to skin tissues (P<0.001), and in invasive group than noninvasive one (P<0.05). Independent t-test. SE, standard error of the mean.
