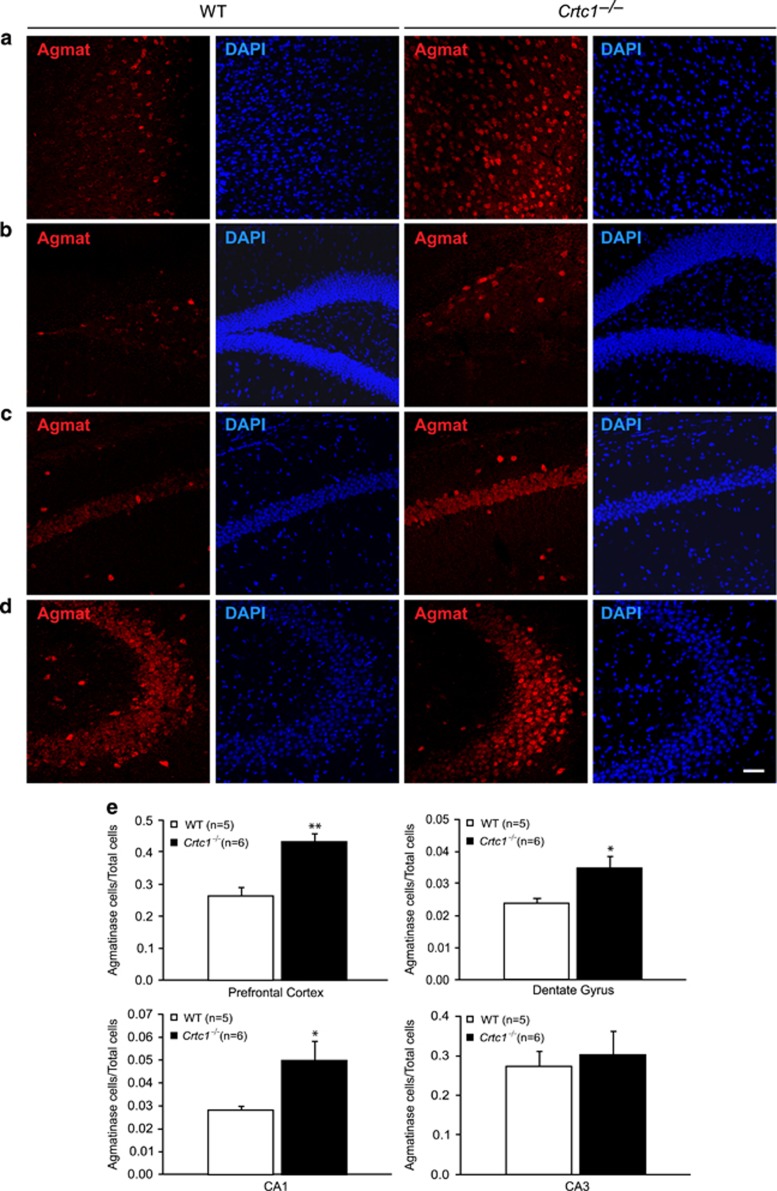
Figure 2.
Increased number of agmatinase (Agmat)-expressing cells in male Crtc1−/− mice. Representative immunofluorescence staining of Agmat-expressing cells (red) and total cells (4,6-diamidino-2-phenylindole (DAPI) staining) in the prefrontal cortex (PFC; a), and in the dentate gyrus (DG; b), CA1 (c) and CA3 (d) regions of the hippocampus (HIP). Cell counting resulted in an increased number of Agmat-expressing cells in the PFC, DG and CA1 regions of male Crtc1−/− mice (n=6) compared with wild-type (WT) littermates (n=5; e). No difference in number of Agmat-expressing cells was found in the CA3 region. Results are expressed as ratio between number of Agmat-expressing cells and total number of cells. Data are mean ±s.e.m. *P<0.5, **P<0.01. Scale bar, 50 μm.

