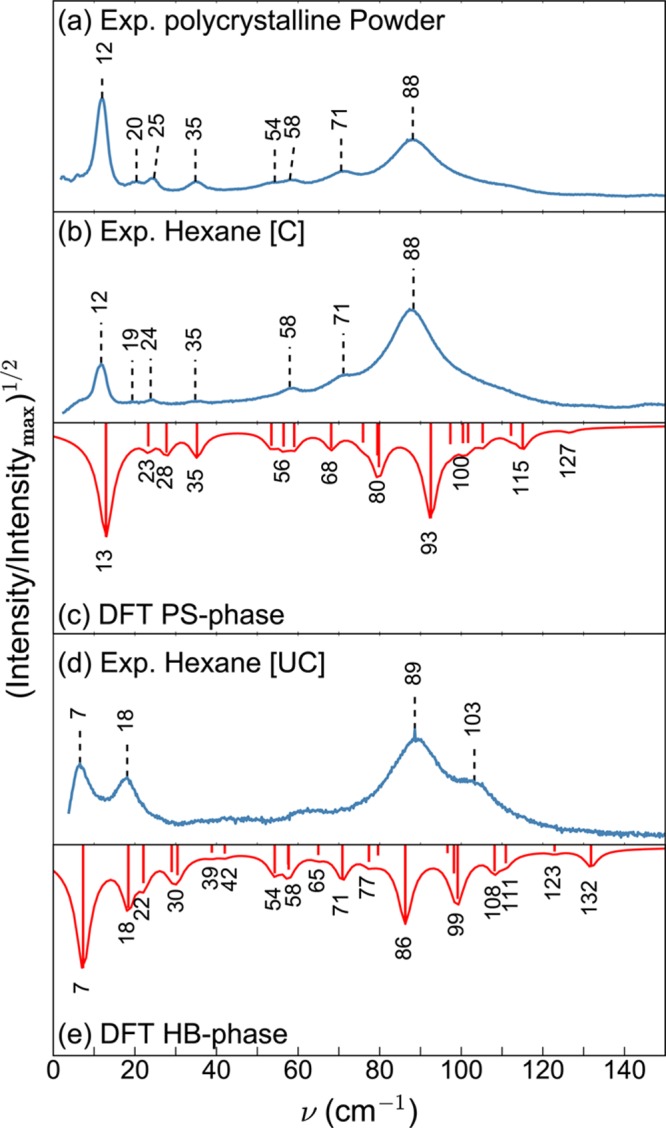
Figure 2.

Experimental Raman spectra of C8O-BTBT-OC8 in the lattice phonon regime of (a) polycrystalline powder and of crystals grown from a hexane solution (b) in partially covered vials [C] and (d) in uncovered vials [UC]. Experiments are compared to DFT calculations of the Raman spectra of (c) the PS phase and (e) the HB phase. For the sake of comparison, the square root of the intensities, normalized to the maximum intensity, is plotted instead of linear intensities. The Lorentzian functions around the calculated peak positions are drawn as a guide for the eye.
