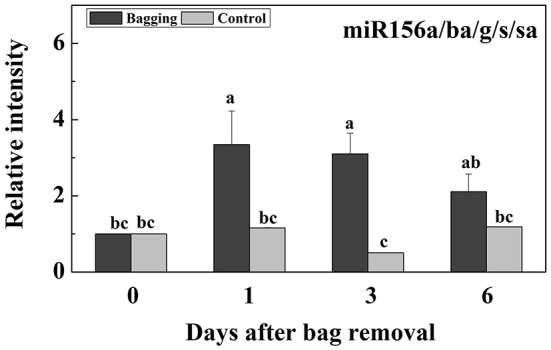
Figure 6.

Expression of miR156a/ba/g/s/sa at different stages after bags were removed from plants. Each value represents the mean ± standard error of three biological replicates.

Expression of miR156a/ba/g/s/sa at different stages after bags were removed from plants. Each value represents the mean ± standard error of three biological replicates.