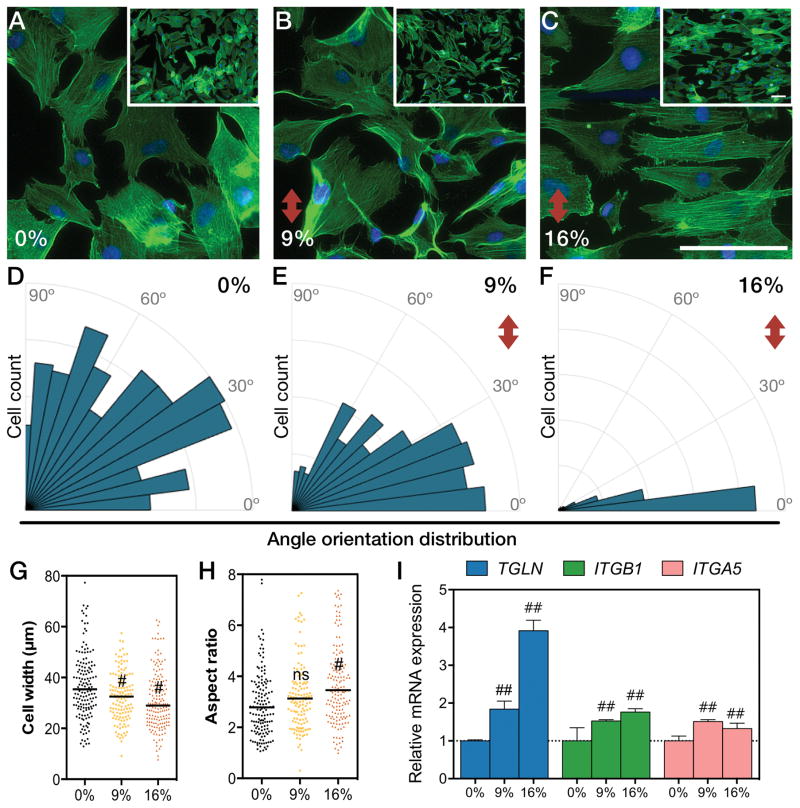
Figure 3. Strain induces cytoskeletal reorientation and contractile phenotype markers on chip.
(A–C) Micrographs of f-actin stained cells under different amounts of strain for 24 hours. Cells exposed to different amounts of strain were quantified on (D–E) angle orientation distribution, (G) cell width and (H) aspect ratio (#, P<0.01; ns, not significant; scale bars represent 100 μm and red arrow indicates direction of strain). Relative mRNA expression levels of TAGLN (SM22α gene), ITGB1 (β1-integrin gene) and ITGA5 (α5-integrin gene) (I) [bars represent mean ± SD of n=5; ##, P<0.01].

