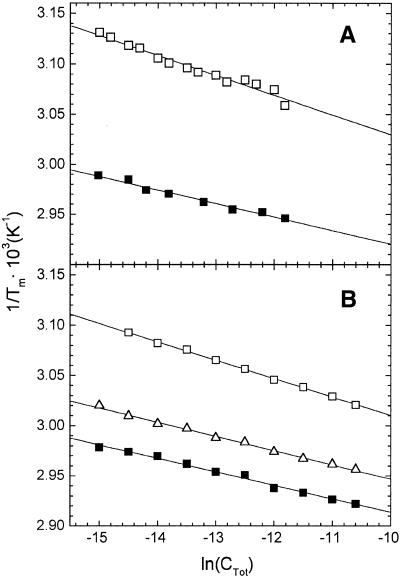
Figure 3.
van’t Hoff plots of 1/Tm versus ln(CTot) depicting the dependence on the total strand concentration (CTot) of the melting temperatures (Tm) for the duplex to single strand transition of the TGGT (A) and AGGA (B) duplexes. Full squares, unmodified duplexes; open squares, duplex containing a site-specific 1,1/t,t-induced 1,2-d(GpG) intrastrand crosslink; open triangles, duplex containing a site-specific cisplatin-induced 1,2-d(GpG) intrastrand crosslink. Each 1/Tm value is an average derived from three melting profiles acquired at 260 nm.

