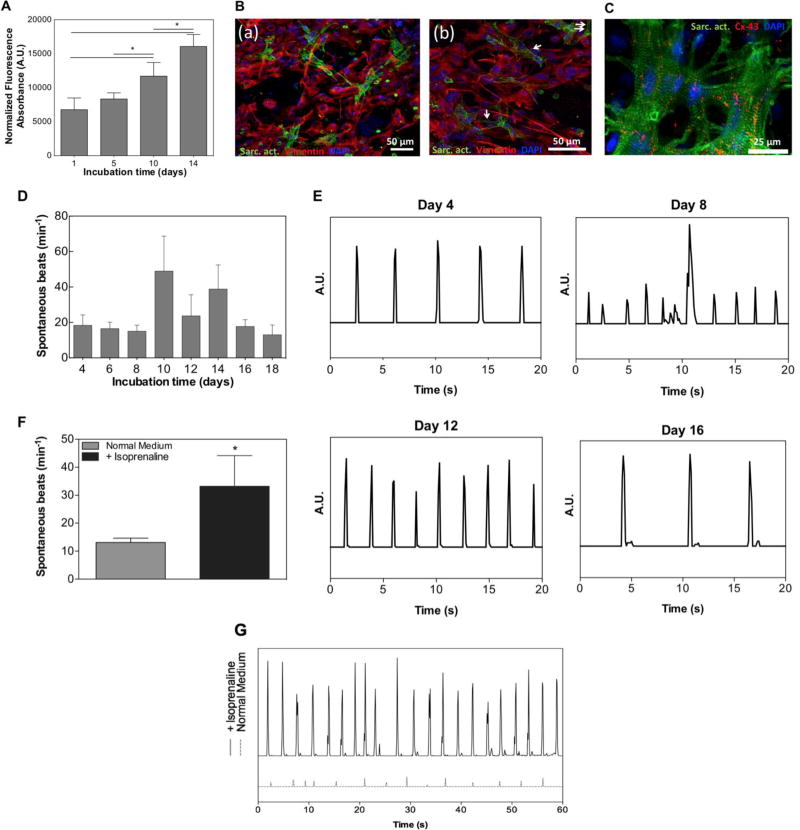
Figure 4. Functional Properties of 3D engineered cardiac tissues.
A) Quantitative analysis of cellular metabolic activity throughout 14 days of culture. B) Representative fluorescence images of immunostained cardiomyocytes (α-sarcomeric actin = green) and cardiac fibroblasts (vimentin = red) on day 14 of culture (a). Higher magnification images of immunostained cardiomyocytes and cardiac fibroblasts showed sarcomeric cross-striations (white arrows) (b). C) Fluorescent image showing well developed sarcomeric striations (= green) and the expression of a gap-junctional protein, connexin-43 (= red). D) Quantitative representation of the spontaneous beats per minute of 3D engineered cardiac tissues from day 4 up until a maximum of 18 days of culture. E) Representative beating pattern of the cardiac tissues at day 4, 8, 12, and 16 of culture. F) Quantitative analysis of the spontaneous beats per minute of cardiac tissues (n=3) in the absence and presence of 1µM isoproterenol (isoprenaline). G) Representation of the beating pattern of cardiac tissues in the absence and presence of isoproterenol at day 6. Data depict Mean ± Standard deviation. *p<0.05

