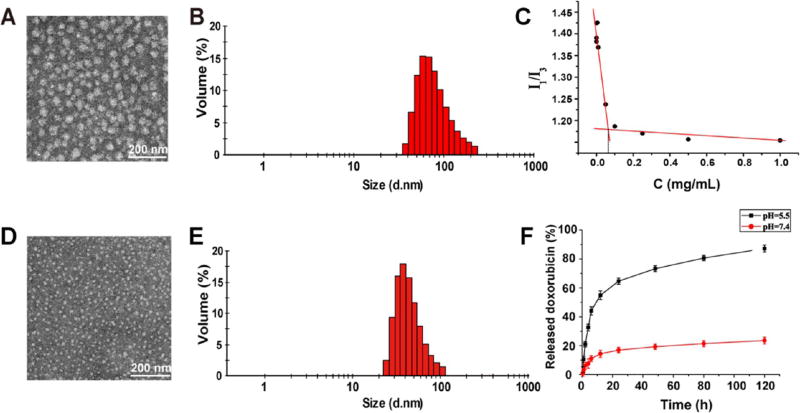
Figure 2.
(A) TEM image and (B) DLS analysis of T1k2k-TOS micelles. (C) I1/I3 intensity ratio vs concentration of T1k2k micelles. (D) TEM image and (E) DLS analysis of T1k2k-TOS-DOX micelles. (F) Cumulative release profile of DOX from T1k2k-TOS-DOX micelles in solutions of pH = 5.5 and 7.4. Data are presented as mean ± SD (n = 3).

