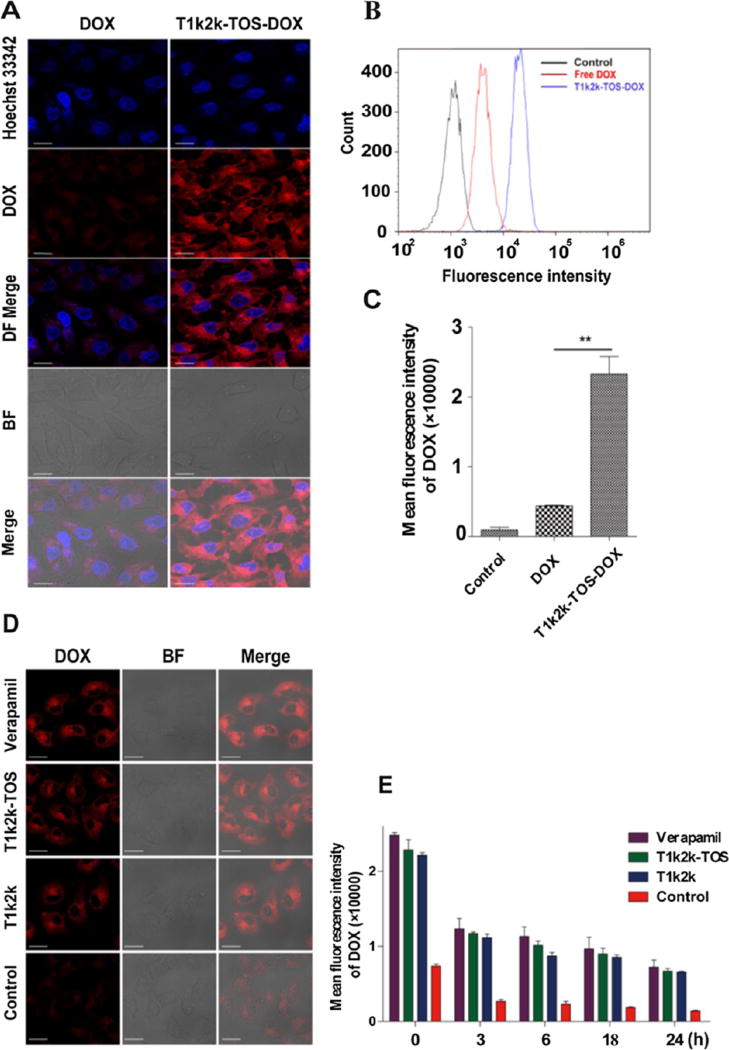
Figure 4.
(A) Fluorescence intensity of DOX in MCF-7/Adr cells visualized using CLSM. (B,C) Fluorescence intensity of DOX in MCF-7/Adr cells measured using flow cytometry. (D) Fluorescence intensity of DOX in MCF-7/Adr cells preincubated with verapamil, T1k2k-TOS, T1k2k, and cell culture medium (control), visualized using CLSM. (E) Fluorescence intensity of DOX in MCF-7/Adr cells preincubated with verapamil, T1k2k- TOS, T1k2k, and cell culture medium (control) at different time points, measured using flow cytometry. Data are presented as mean ± SD (n = 3). Notes: **, p < 0.01. The scale bar is 20 µm.

