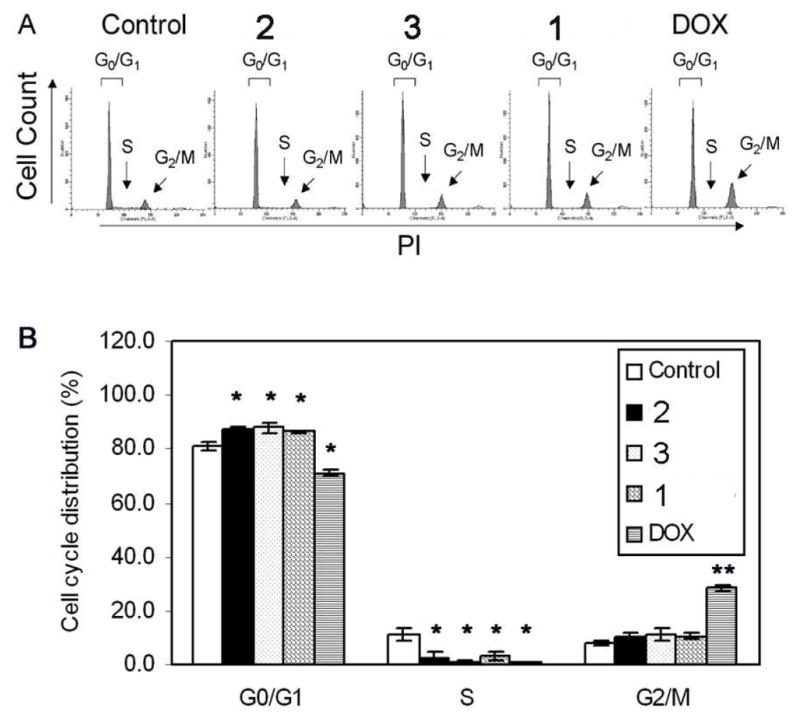
Figure 4.

Induction of G0/G1 cell cycle arrest in LNCaP cells. Cells were treated with vehicle (control) or 50 nM of either 1, 2, 3 or DOX for 72 h. Cell cycle distribution was determined by PI staining and flow cytometry. (A) Histograms of cell cycle distribution, and (B) mean cell cycle distribution (%) in the G0/G1, S and G2/M phases of three independent experiments ± SEM. *, P < 0.05; **, P < 0.0001 by ANOVA.
