
Figure 6.
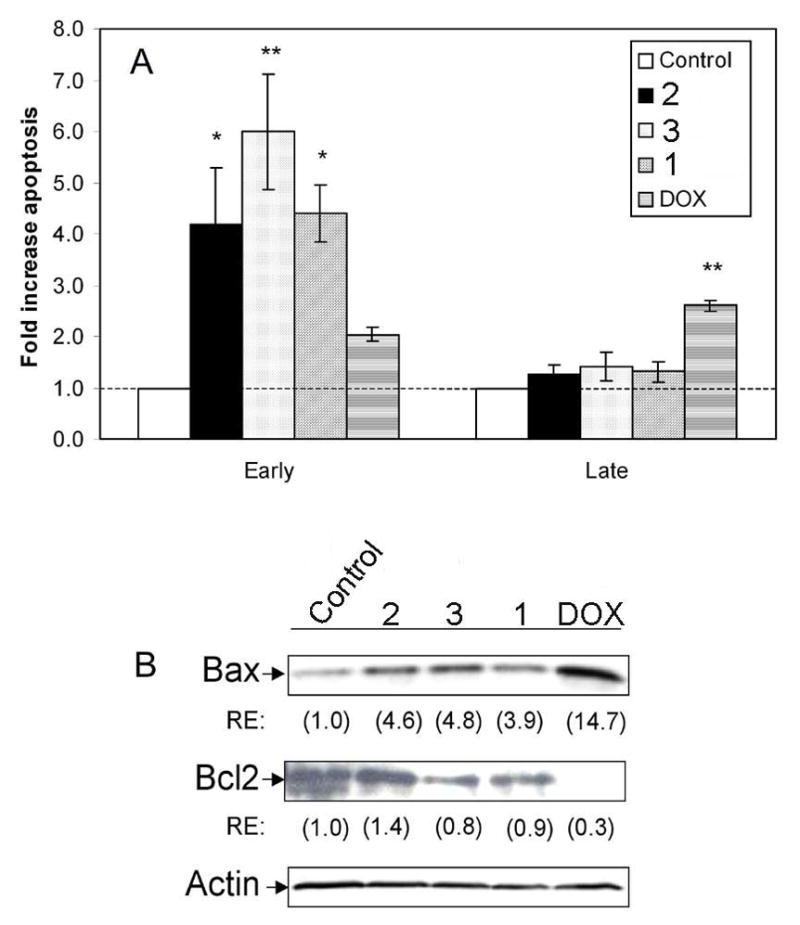
Induction of apoptosis in LNCaP cells. Cells were treated with vehicle (control) or 50 nM of either 1, 2, 3 or DOX for 72 h. Apoptosis was measured by annexin V-PE/7-AAD staining. (A) Mean fold increase in early stage (annexin V positive cells) and late stage (annexin V and 7-AAD positive cells) apoptosis ± SEM normalized to control group (fold increase = 1.0). *, P < 0.05; **, P < 0.001 by ANOVA. (B) Western blot analysis was performed with anti-bax and -Bcl-2. Actin was used as loading control. RE, relative expression of proteins was determined by densitometry and normalized to actin.