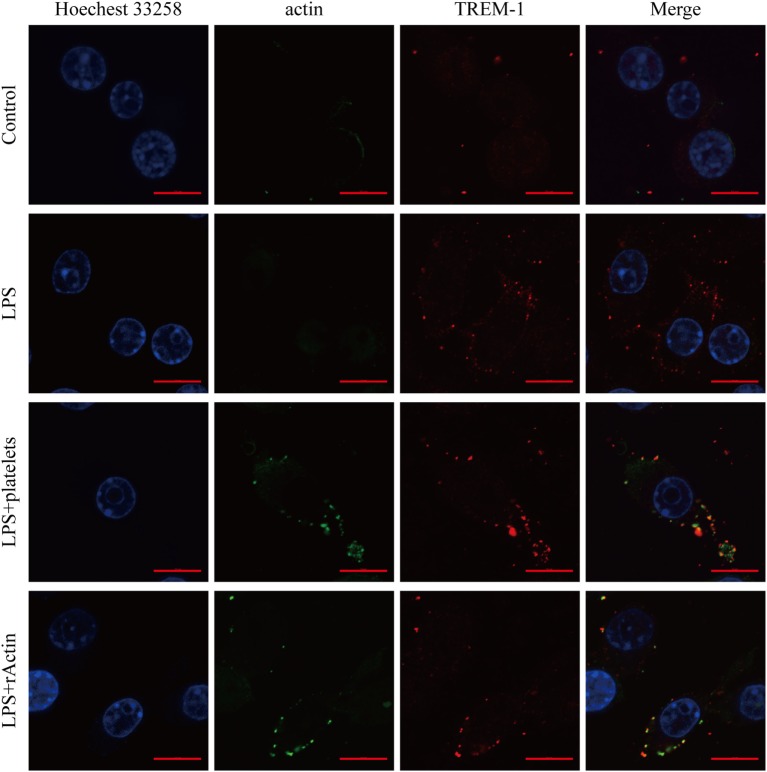
Figure 3.
Analysis of the co-localization of triggering receptor expressed on myeloid cells-1 (TREM-1) and actin by laser scanning confocal microscopy. RAW264.7 cells were mock treated with PBS or treated with LPS, platelets, or rACTIN. All cells were fixed and then incubated with mouse TREM-1 antibody antigen affinity-purified polyclonal goat IgG and rabbit anti-beta actin polyclonal antibody, followed by FITC-conjugated affinipure donkey anti-rabbit IgG (H + L) and CY3-conjugated affinipure donkey anti-goat IgG (H + L). After staining the nuclei with Hoechest 33258, the slides were analyzed with a LSM880 with Airyscan laser scanning confocal microscope and ZEN2.3 LITE software. The scale bars in the figure represent 10 µm.

