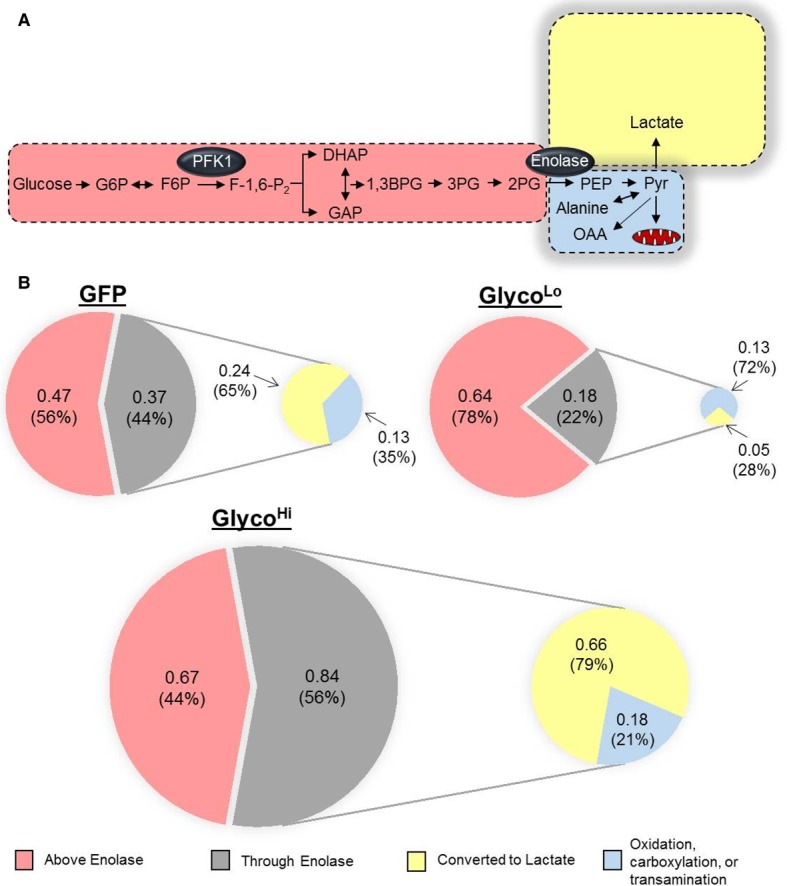
Figure 2. Phosphofructokinase-mediated glucose distribution in isolated cardiomyocytes.

Schematics illustrating glucose utilization in myocytes transduced with GFP, GlycoLo, or GlycoHi adenoviruses. Measurements from radiometric and isotopic glucose utilization assays were used to delineate glucose distribution in neonatal rat cardiomyocytes transduced with each virus. (A) Schematic illustrating glucose distribution in control (GFP) myocytes. Distributions of glucose are drawn to relative scale. (B) Pie chart illustrating the distribution of glucose: numbers (in nmol/h/µg protein) and percentages (%) indicate the absolute and relative distribution of glucose ascribed to the portions of glucose metabolism: upstream of enolase (light red), through enolase (gray shading), converted into lactate (yellow), and available for transamination to alanine, anaplerotic formation of oxaloacetate (OAA), or glucose oxidation (light blue). Pie charts are drawn to scale. Both schematics consider glucose uptake and lactate production provided by [13C6]-glucose tracing and by glucose utilization measured by radiometric assays, respectively.
