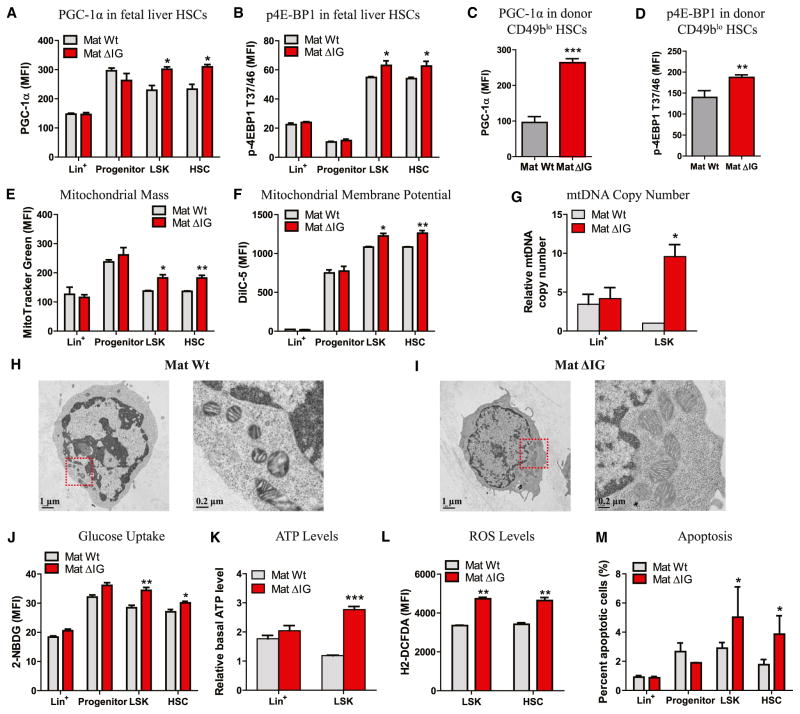
Figure 6. Loss of Imprinting at the Dlk1-Gtl2 Locus Enhanced Mitochondrial Biogenesis and Metabolic Activity and Increased ROS Levels in HSCs.
(A–D) MFI of PGC-1α and p-4E-BP1T37/46 in fetal liver HSCs (A and B, n = 3) and donor CD49blo HSCs from BM of 3rd recipients (C and D, n ≥ 4).
(E) Mitochondrial mass of WT and mat ΔIG cells assayed by MitoTracker Green staining (n = 3).
(F) Mitochondrial membrane potential of WT and mat ΔIG cells assayed by DilC5 staining (n = 3).
(G) Relative mitochondria DNA copy number of WT and mat ΔIG cells assayed by qRT-PCR (n = 2).
(H and I) Representative TEM images of mitochondrial morphology in WT and mat ΔIG LSK cells.
(J) Glucose uptake of WT and mat ΔIG cells assayed by 2-NBDG (n = 3).
(K) Relative basal ATP levels of WT and mat ΔIG cells (n = 2).
(L) ROS levels of WT and mat ΔIG cells assayed by H2-DCFDA (n = 3).
(M) Percentage of apoptotic cells in WT and mat ΔIG cells assayed by Annexin V and 7-AAD staining (n = 3).
Error bars, SEM or SD (C and D). *p < 0.05; **p < 0.01; ***p < 0.001. See also Figure S6 and Table S7.

