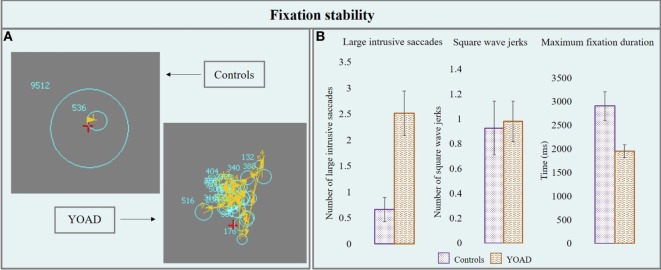
Figure 1.
(A) Performance of a control and a young onset Alzheimer’s disease (YOAD) patient in the fixation stability task: light blue circles show fixations, yellow arrows indicate saccades, and red crosses represent target position. (B) Group means for controls and YOAD patients for the different task metrics. Error bars represent SE.

