Figure 2.
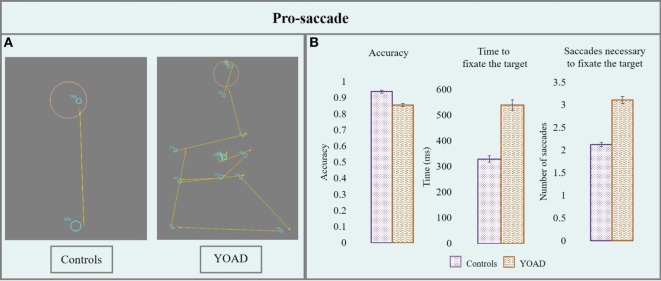
(A) Performance of a control and a patient with young onset Alzheimer’s disease (YOAD) in the pro-saccade task: light blue circles show fixations, yellow arrows indicate saccades, red crosses represent target position and orange circles outline the interest area (1.5° from the center of the target). (B) Group means for controls and YOAD patients for the different task metrics. Error bars represent standard error.

