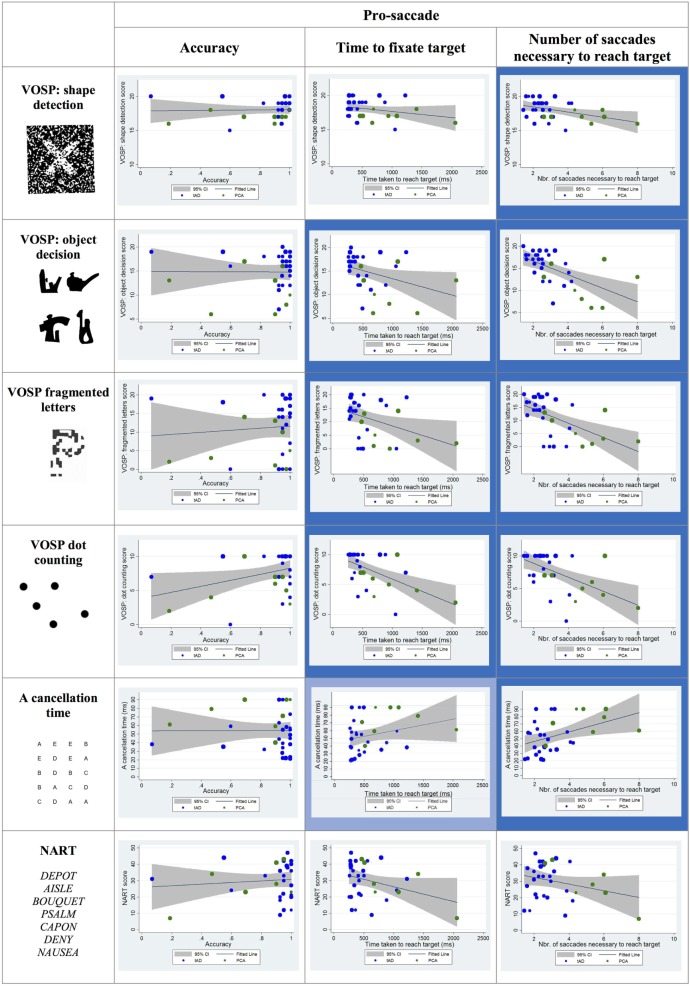
Figure 5.
Scatter plots showing correlations between pro-saccade metrics and visual cognitive scores for young onset Alzheimer’s disease patients. Statistically significant correlations are marked with a blue background and statistical trends (p > 0.05 and p < 0.10) in a lighter blue. Best fit line and 95% CI are shown. Each data point corresponds to a participant and its size is proportionate to the Mini-Mental State Examination score (disease severity). typical AD (tAD) individuals are shown in blue and posterior cortical atrophy (PCA) in green.

