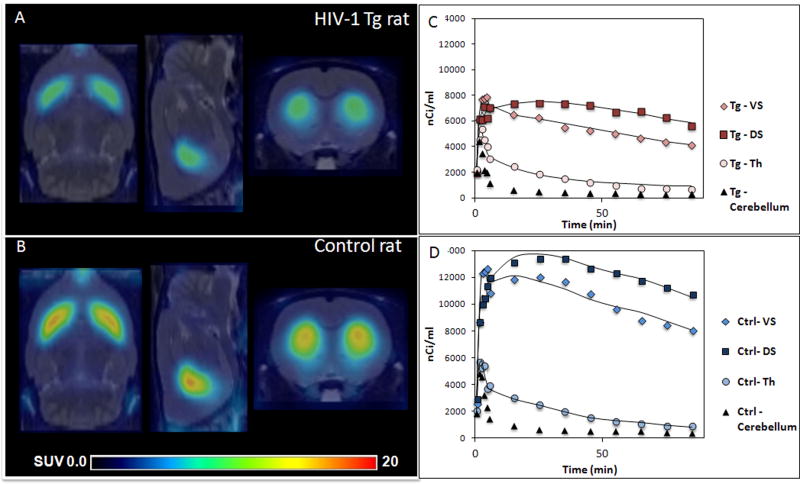
Figure. 1.
Reduced uptake of [18F]fallypride is qualitatively detectable in the Tg rat compared to the control rat. Shown are axial, sagittal, and coronal MR co-registered, normalized [18F]fallypride PET images at the level of the striatum from (A), a representative adult HIV-1 Tg rat and (B), a representative age-matched control. Both images represent summed data from PET acquired between 50 to 90 min after injection and are displayed on a common scale (0–20 SUV, radioactivity normalized by injected dose). Time-activity curves of [18F]fallypride injections obtained from the dorsal striatum (DS) and ventral striatum (VS) (left and right averaged), thalamus (Th), and cerebellum are shown in (C) an adult HIV-1 Tg and (D) an adult control rat. The solid lines represent the quality of data fit obtained using the 2-Tissue reference model with the cerebellum as reference.

