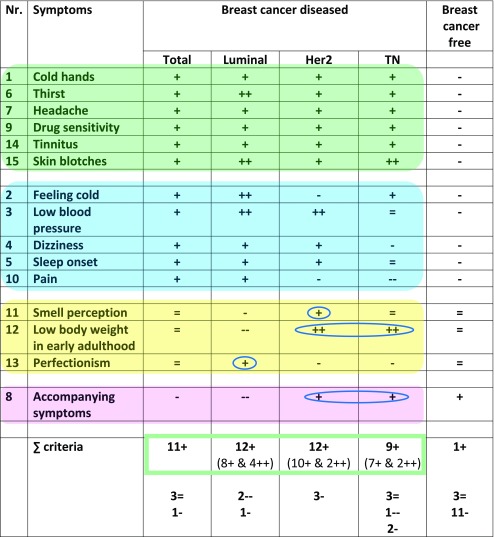
Table 2.
Symptoms of the "Flammer syndrome" recorded in breast cancer-diseased versus breast cancer-free groups of comparison; the table summarises the results demonstrated in Fig. 1 by utilising the following system: with “+”, the group is noted which demonstrates higher prevalence of the corresponding symptom (above the lowest average of the groups of comparison); with “−”, the group is noted which demonstrates lower prevalence of the corresponding symptom (lowest average and below it); “=” means both groups of comparison demonstrate similar prevalence of the corresponding symptom; “++” means values sufficiently over the highest average; “--” means values sufficiently below the highest average; ellipses mark the symptoms which are more prevalent in individual subgroups; ∑criteria summarise the number of symptoms which are more (+) or less (-) prevalent in corresponding sub/groups

